Million Dollar Blocks in Brooklyn's Community District 16

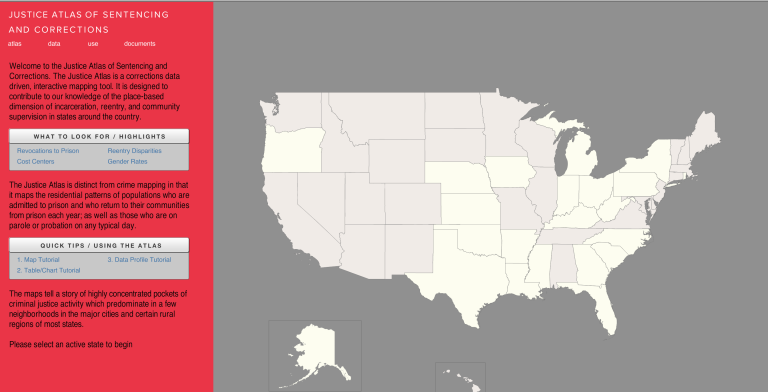
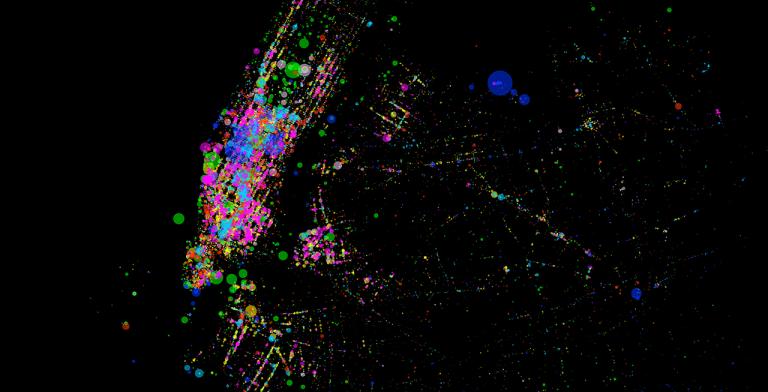
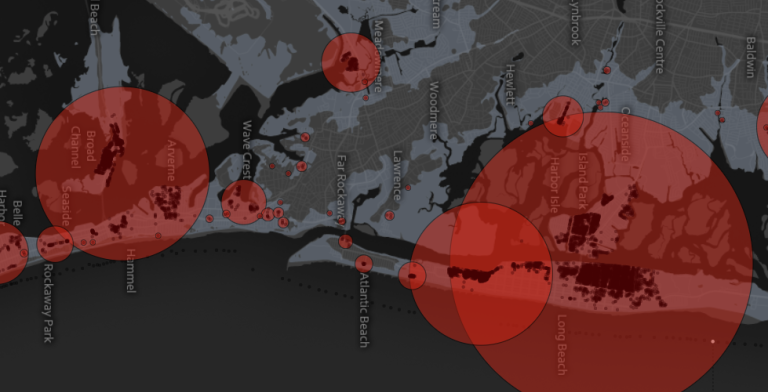
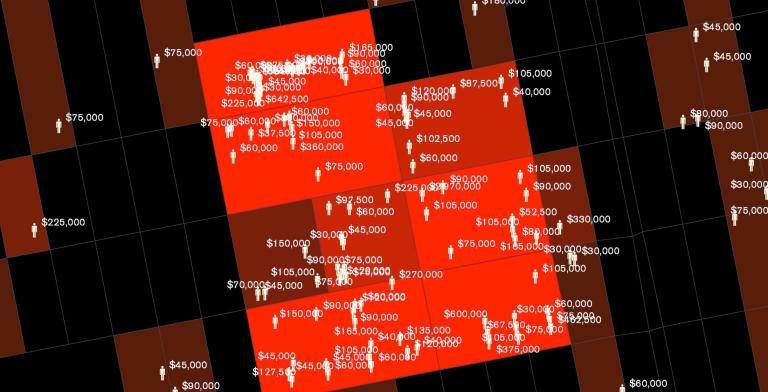
The United States currently has more than two million people locked up in jails and prisons. A disproportionate number of them come from a very few neighborhoods in the country’s biggest cities. In many places the concentration is so dense that states are spending in excess of a million dollars a year to incarcerate the residents of single city blocks. Using rarely accessible data from the criminal justice system, the Spatial Information Design Lab and the Justice Mapping Center have created maps of these “million dollar blocks” and of the city-prison-city-prison migration flow for five of the nation’s cities.

Million Dollar Blocks

Exits, a panoramic multi-media installation which was on view at the Cartier Foundation in Paris, France from November 2008 – March 2009 as part of “Elsewhere starts here,” conceptualized by Paul Virilio. The project was part of a larger exhibition, Terre Natale: Stop Eject.
 

Terre Natale: Exits Part 2
Justice Map Interface

The Justice Atlas is distinct from crime mapping in that it maps the residential patterns of populations who are admitted to prison and who return to their communities from prison each year; as well as those who are on parole or probation on any typical day.  The maps tell a story of highly concentrated pockets of criminal justice activity which predominate in a few neighborhood in the major cities an certain rural regions of most states.

Justice Atlas of Sentencing and Corrections
Foursquare venues and check-ins in New York

Social media are increasingly becoming part of our everyday lives, from connecting with friends and sharing images to exploring cities through location-based applications. These new services have given us a different vantage point from which to understand, explore, navigate, and geographically record the places we live. This project explores the new geogrphies produced by these new services through a series of maps.

Here Now: Social Media And The Psychological City
SIDL Sandy Main Image

Superstorm Sandy made landfall in New Jersey on October 29th. Data generated by governments and volunteers in the weeks following the storm stand to provide critical insight into how the region was affected. These pages make such data visible, and serve as launching pad for further investigations and questions of the impact of the storm.

Superstorm Sandy
GPS pings from oil and other energy carrying vessels

Using D3 as an interactive web platform we designed a map interface that is scaled globally while embedded with local stories about energy movement from port to port. Data can be viewed across time, which reveal changes in patterns of movement as the geopolitics, price of oil, and conditions at specific ports change.

In collaboration with Thomson Reuters Research Unit.

Port to Port