Prof. Marguerite Holloway and Prof. Dan Jurafsky presenting the Science Surveyor project

The Science Surveyor team built a tool for science journalists that makes it easier for them to put new studies into context. This tool captures and visualizes the corpus of scientific literature to put new scientific findings into a publication timeline, showing journalists where a study lies in relation to scientific consensus, who funded it and sources a reporter might want to call to get more information.
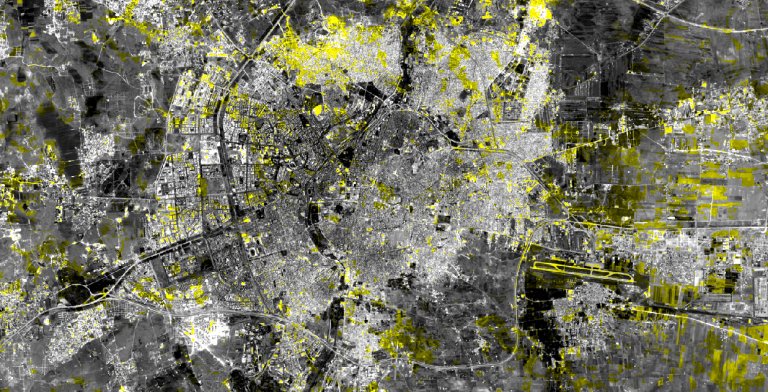
CSR Conflict Urbanism Aleppo June 2016

To mark its inaugural year, The Center for Spatial Research will present its work on "conflict urbanism" in Aleppo, and Colombia. The event will engage participants in a discussion about the role of conflict in structuring urban space and the politics of representation in zones of discordance, disruption and violence as it contributes to the making and remaking of cities.

Citi Bike Data Visualization

Juan Francisco Saldarriaga will be leading a workshop on how to download API data using Python in the context of the Art of Data Visualization conference to be held at Columbia University on April 7th. The workshop will take place at the Digital Social Science Center (215 Lehman Library) from 10:30 AM to 11:30 AM.

Candy Map Foursquare NYC Map
Juan Francisco Saldarriaga will be presenting two recent center projects in his talk ‘Activity Mapping’ during the Art of Data Visualization conference to be held at Columbia University on April 6th. The talk will take place at the Davis Auditorium (room 412 Schapiro CEPSR) from 10:50 AM to 11:30 AM.
EYEO Slide

Laura Kurgan and Jen Lowe gave a talk titled "Multiple Dimensions" at Eyeo 2013 where they discussed interdisciplinary projects in progress.