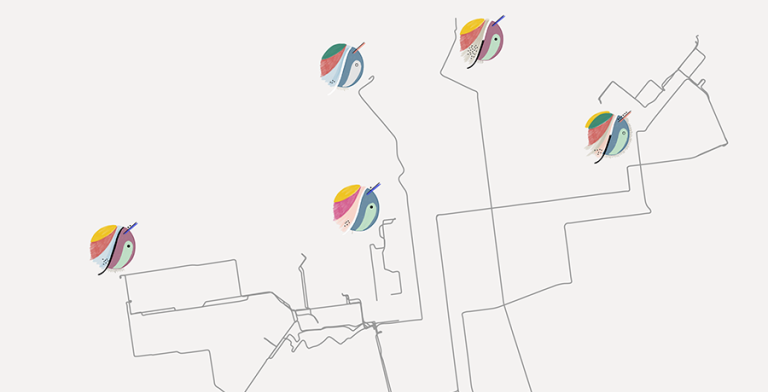
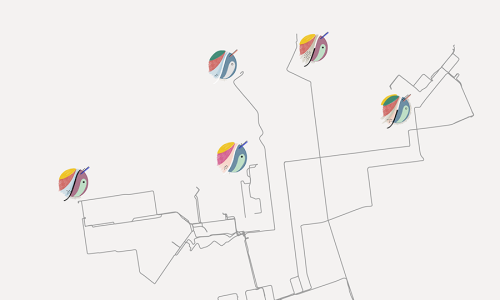
We Can is a multimedia storytelling project that explores the lives and activity of canners, people who pick up cans and bottles on NYC streets. We combined oral history, manual data collection, mapping and illustration to encourage a more critical observation of a community and its subculture. The mapping component consists in GPS tracked canners’ daily itineraries that unfold, while revealing the quantitative and qualitative data collected manually.
One of the biggest challenges facing science journalists is the ability to quickly contextualize journal articles they are reporting on deadline. Science Surveyor is a tool that can help science journalists and others rapidly and effectively characterize the scientific literature for any topic by providing a contextual consensus, and a timeline of publications surrounding the topic.
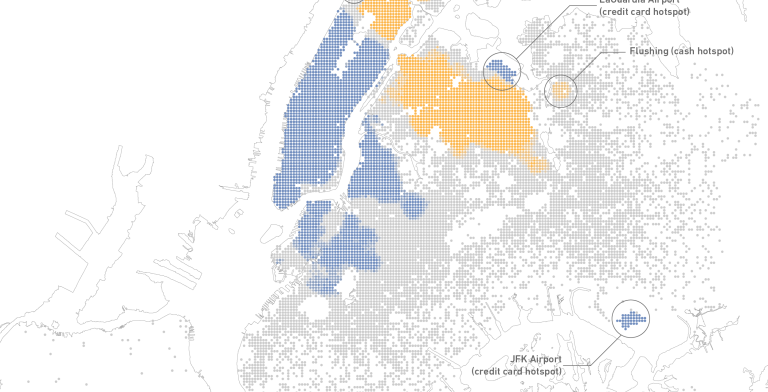
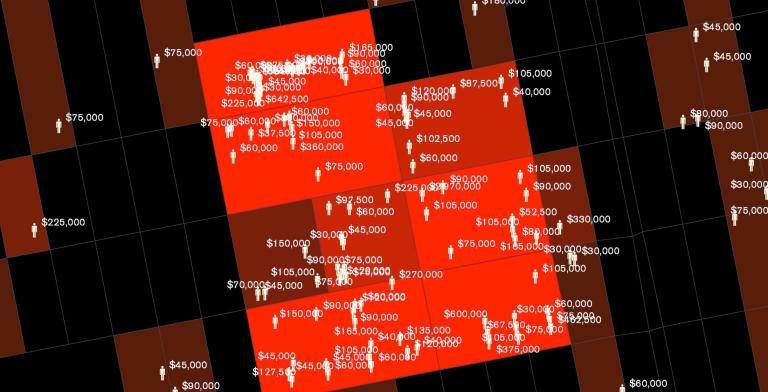
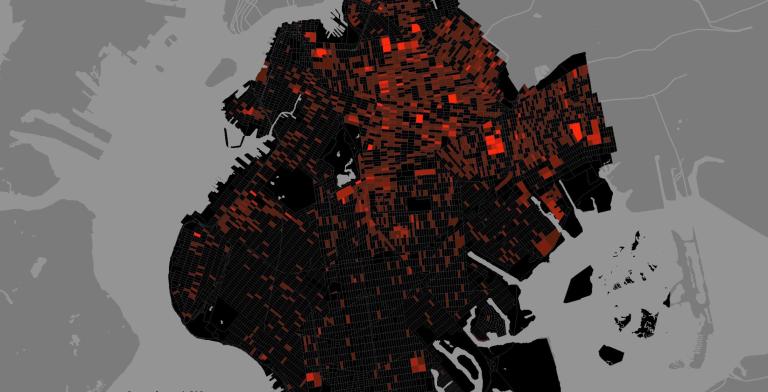
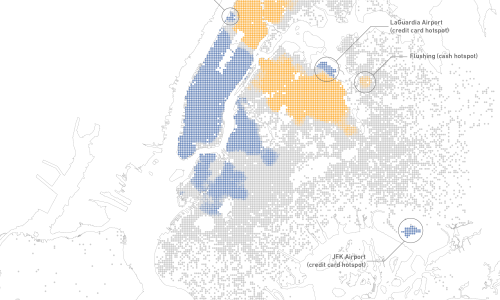
The Banking Divide For Taxi Access: Evidence From New York City
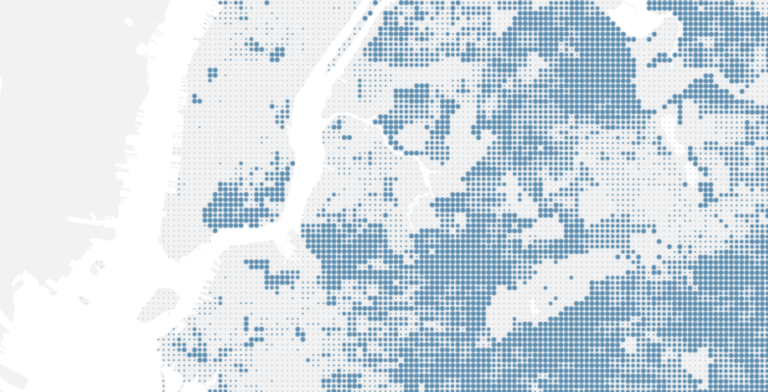
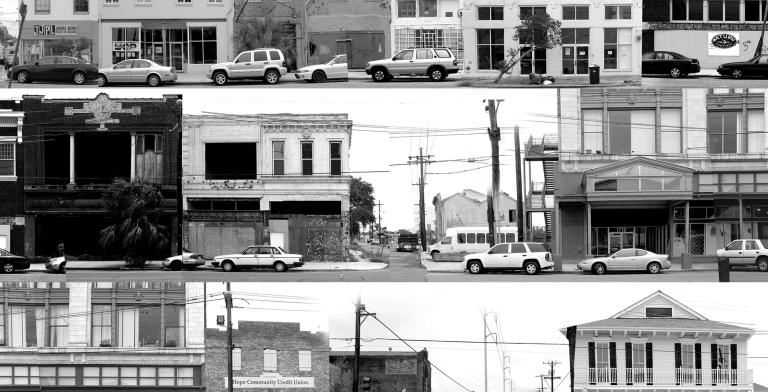
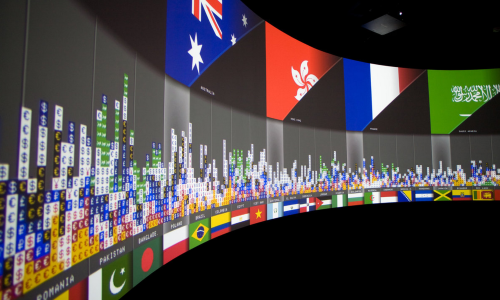
Since 2008 yellow taxis have been able to process fare payments with credit cards, and credits cards are a growing share of total fare payments. However, the use of credit cards to pay for taxi fares varies widely across neighborhoods, and there are strong correlations between cash payments for taxi fares, cash payments for transit fares and the presence of unbanked or underbanked populations. In this paper we use multiple datasets to explore taxicab fare payments by neighborhood and examine how access to taxicab services is associated with use of conventional banking services.
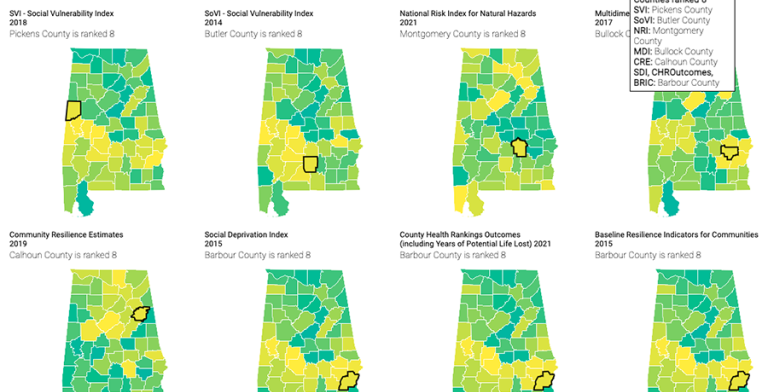
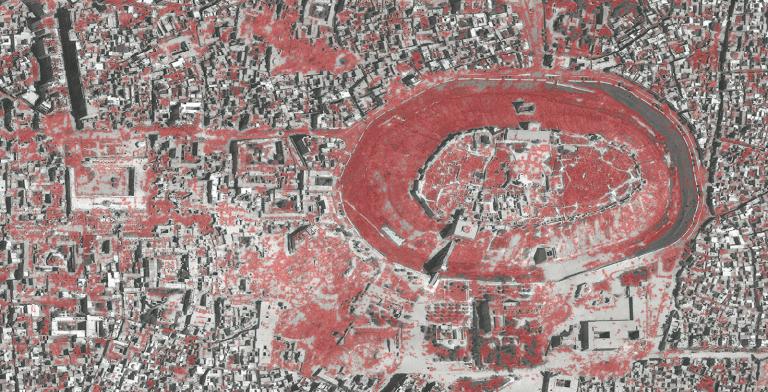
This project is an analysis of New York City neighborhoods according to specific health, demographic and environmental metrics. We worked with the New York Restoration Project (NYRP), which is developing a master plan to renovate a network of open spaces in Mott Haven and Port Morris in the South Bronx. Over the next several years, NYRP will fund the renovations and build them. As a first step, we will capture baseline health data and quality of life indicators which we will track as the project progresses.
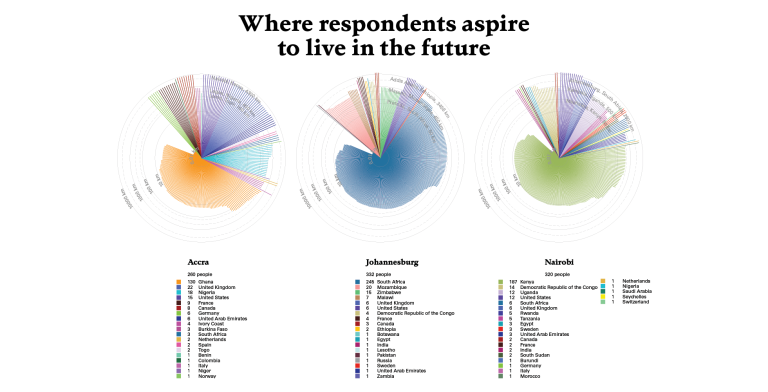
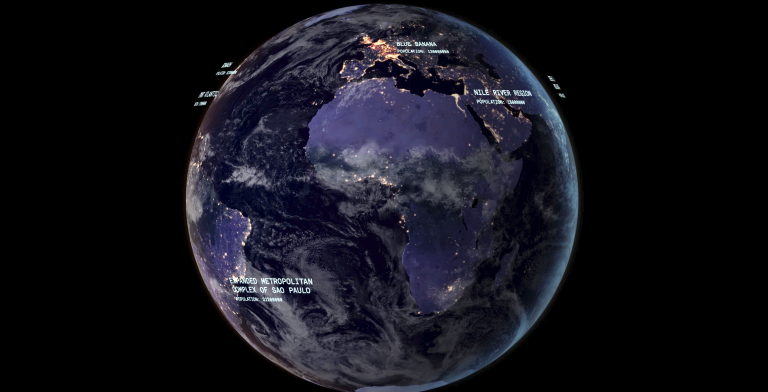
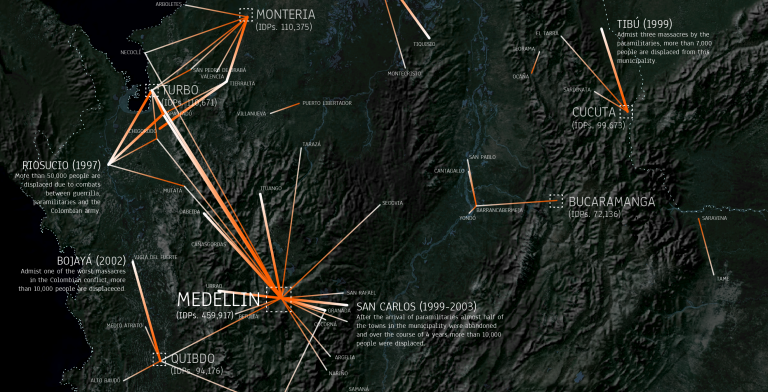
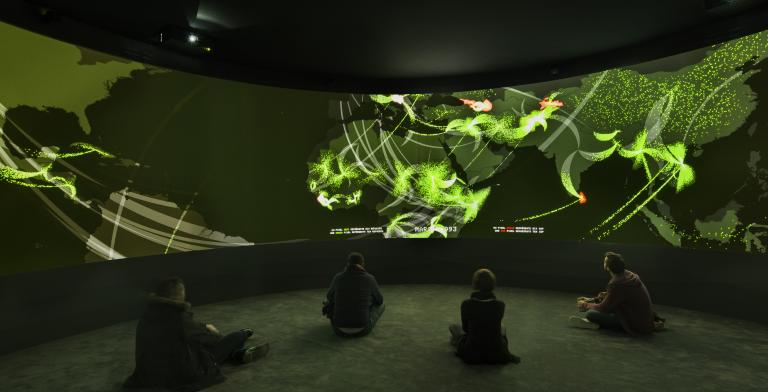
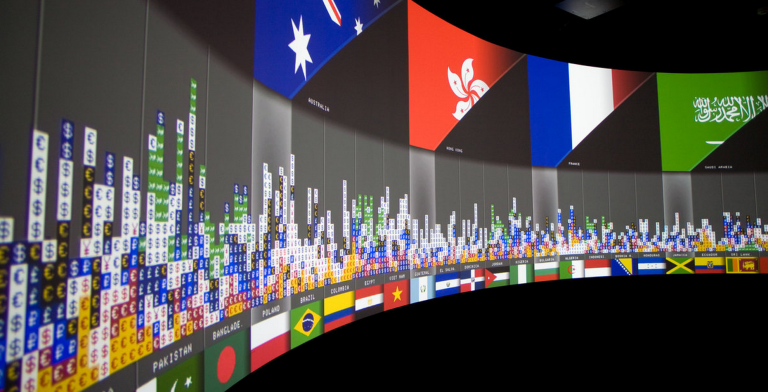
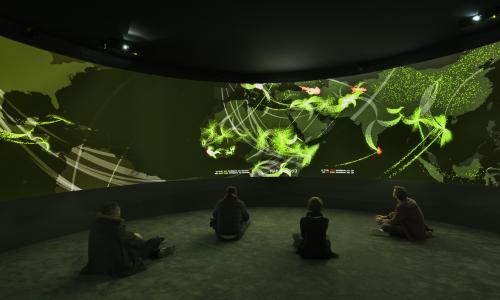
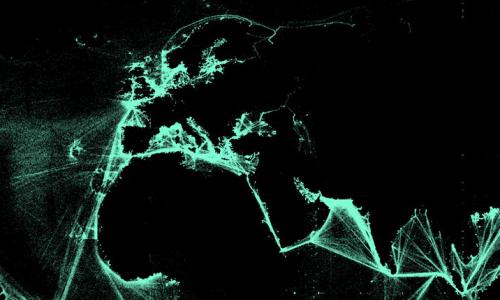
Exit is an immersive installation that investigates global human migrations. The maps are made from data which has been collected from a variety of sources, geocoded, statistically analyzed, re-processed through multiple programming languages and translated visually. Updated to coincide with Cop21 it was exhibited at Palais Tokyo from November 25, 2015 – January 10, 2016.
As has been recently documented by the press, one of the major challenges that Citi Bike is facing is the rebalancing of their stations. As origins and destinations of Citi Bike trips are not necessarily symmetrical during the day, Citi Bike has been forced to constantly move bikes around the city, taking them from full stations and delivering them to empty ones. This problem is both financially expensive and frustrating for Citi Bike users: many people complain about either not finding bikes at their stations of origin or not finding empty spots when they arrive at their final destinations.
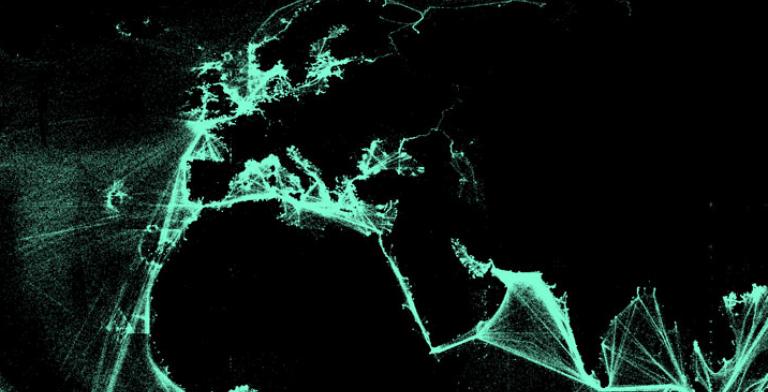
Using D3 as an interactive web platform we designed a map interface that is scaled globally while embedded with local stories about energy movement from port to port. Data can be viewed across time, which reveal changes in patterns of movement as the geopolitics, price of oil, and conditions at specific ports change.
In collaboration with Thomson Reuters Research Unit.
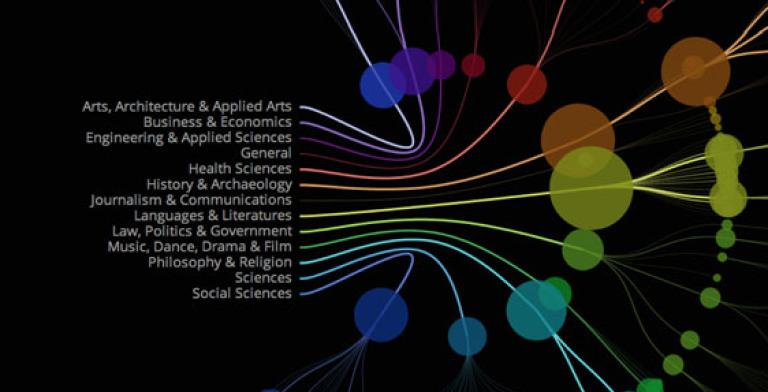
Today, when one walks into a library, whether public or private, there is no way to comprehend the immensity, character and value of its collection. Perhaps this is visible in the vastness of the stacks, or of the building, but for the most part, the collection remains invisible. “Serendipity Search” will allow for surfacing of books and other media stored in the library, into the hands of researchers and interested individuals through a more compelling and curiosity-provoking interface. In our current prototype, at the first level, we have visualized the Columbia Libraries collection in a single interactive interface. At the second level, we have designed our first tool which browses library book which have multiple subjects in their metadata.
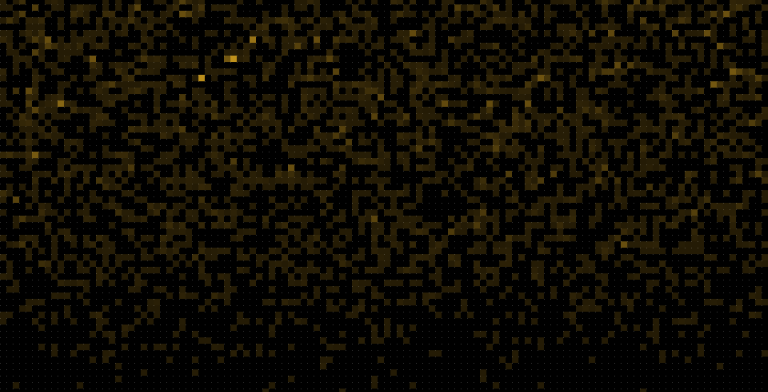
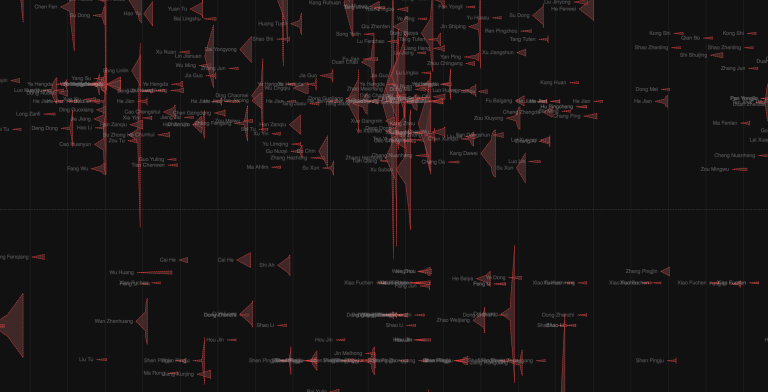
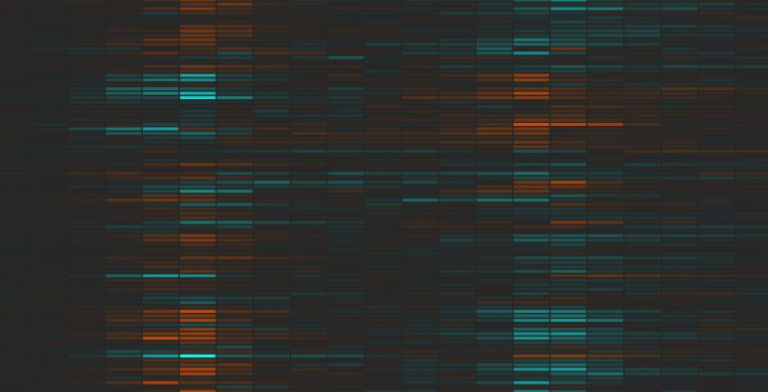
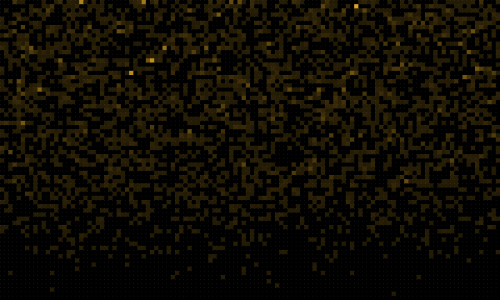
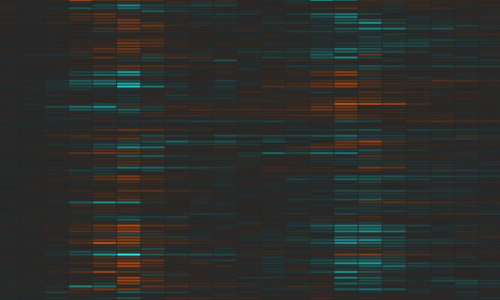
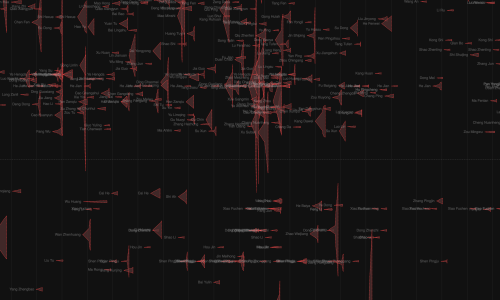
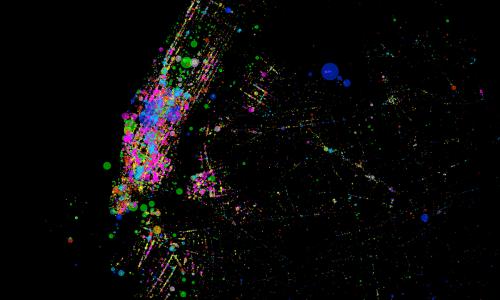
This project visualizes a relatively new phenomenon: online free expression in China. It examines some innovative strategies employed by users of Weibo, a Twitter–like micro–blogging platform, in order to avoid government censorship bloggers post images as text. Images are much more difficult for automated search programs to analyze, which allows image-based content to spread more widely before it is detected and removed. Taking advantage of this, some users now turning writing into images, taking screenshots of their own and others' controversial posts before they're removed, then posting and re–posting them. The project visualizes Weibo posts that were posted and deleted between September 8th to November 13th, in 2013.
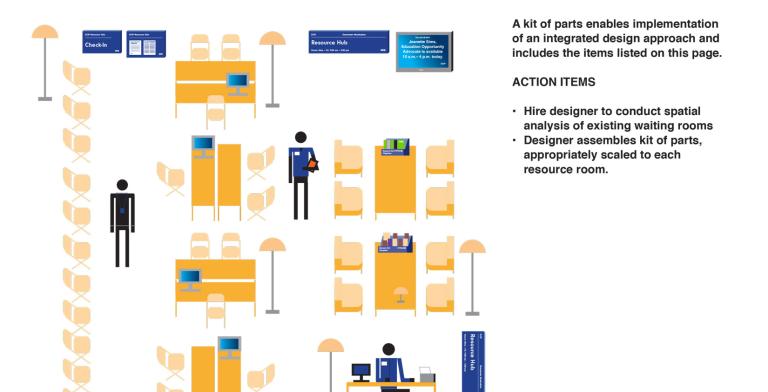
Our design for this space includes exhibits, visualizations and story-telling components, and draws upon the disciplines of architecture, journalism, art, psychology, education, design and more. The goal of the initiative is to create a networked public space that will actively engage, and be genuinely accessible to, a heterogeneous population of visitors, including resident scientists and community members alike.
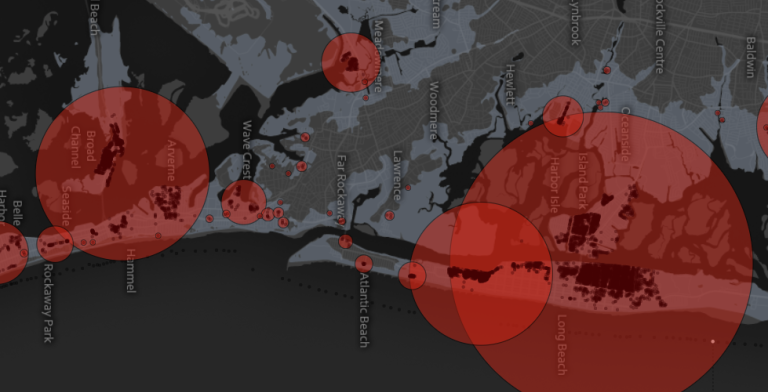
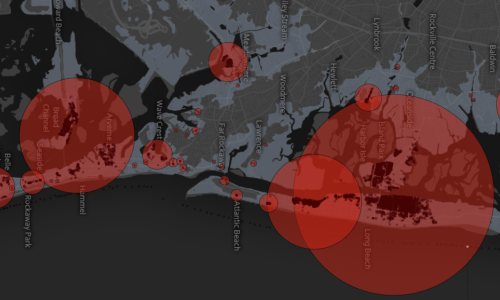
Superstorm Sandy made landfall in New Jersey on October 29th. Data generated by governments and volunteers in the weeks following the storm stand to provide critical insight into how the region was affected. These pages make such data visible, and serve as launching pad for further investigations and questions of the impact of the storm.
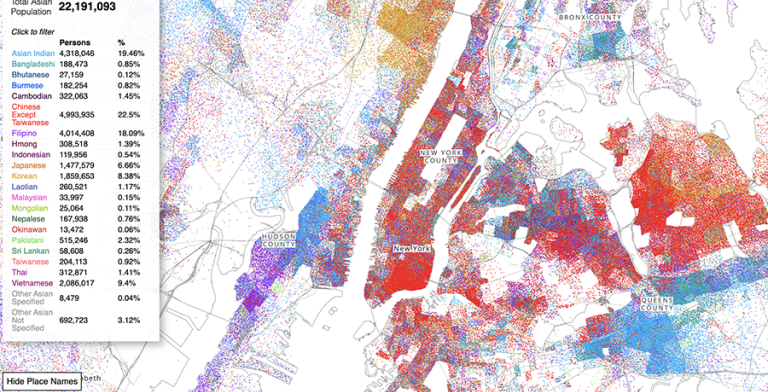
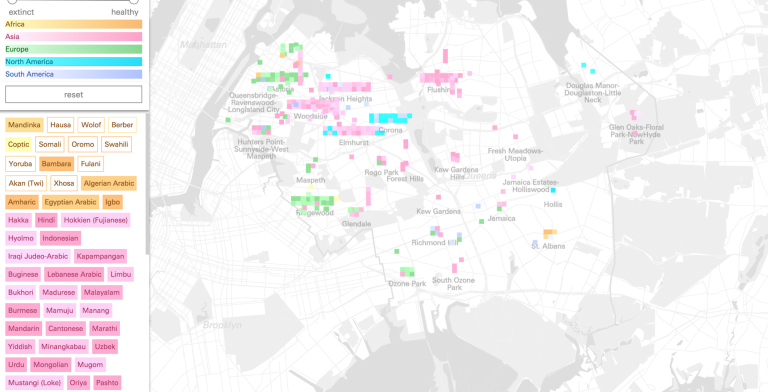
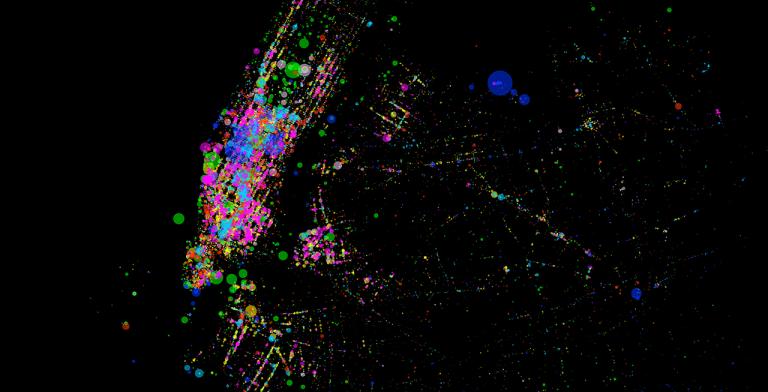
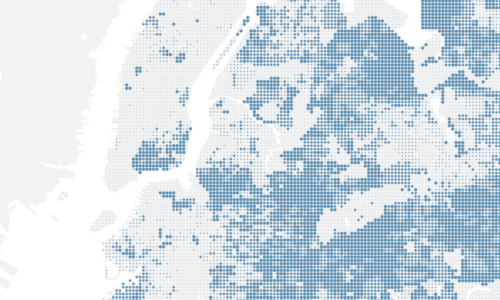
Social media are increasingly becoming part of our everyday lives, from connecting with friends and sharing images to exploring cities through location-based applications. These new services have given us a different vantage point from which to understand, explore, navigate, and geographically record the places we live. This project explores the new geogrphies produced by these new services through a series of maps.
Exits, a panoramic multi-media installation which was on view at the Cartier Foundation in Paris, France from November 2008 – March 2009 as part of “Elsewhere starts here,” conceptualized by Paul Virilio. The project was part of a larger exhibition, Terre Natale: Stop Eject.