
Georeferencing: Colonial Map of Mumbai

Colonial Map of Mumbai

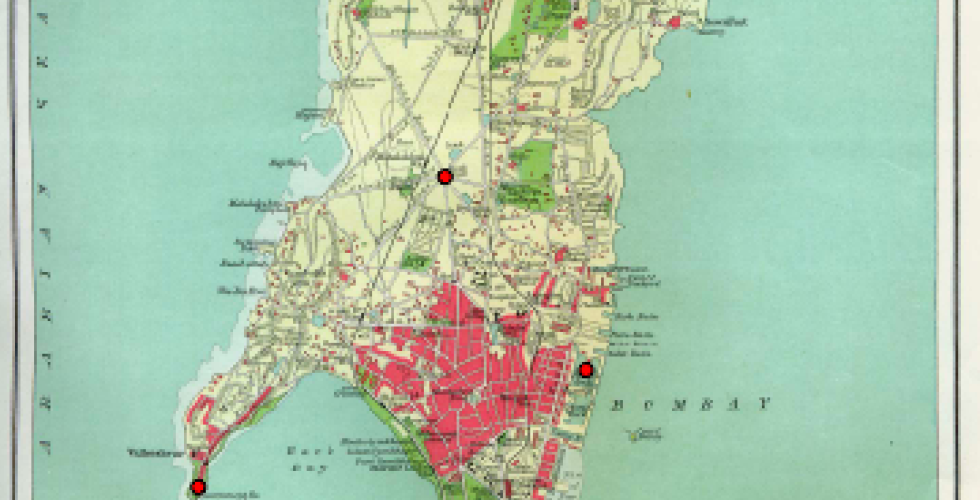
In this exercise, you will explore some of the georeferencing tools available in QGIS and use them to georeference a 1909 map of Mumbai, "Island of Bombay". You will learn how to use GIS tools to georectify raster datasets. You will then use the georeferenced map to digitize vector features from the map infomation.

Working with Projections

Projections enable us to represent the earth on a flat surface. This tutorial will walk through the process of creating a U.S. population density map in the Albers equal-area conic projection, a standard way of representing the United States with minimal distortion.

Analyzing Data: Introduction to Geoprocessing

Analyzing Data: Introduction to Geoprocessing

Through this exercise you will learn key tools of analysis using QGIS. After completing these exercises you should be able to use proximity based measures, understand the principles and applications of boolean operations, conduct spatial joins, explain and perform proportional split population estimates

Working with U.S. Census Data

Final Map from Working with U.S. Census Data

This tutorial will guide you through the process of downloading both the geographical boundaries and the census data, bringing them both into QGIS and joining them, and creating a choropleth map.

Making Data: Aggregating 311 Complaints

Making Data: Aggregating 311 Complaints Final Map

In this tutorial, you will: download 311 data for New York City, create a categorical and a quantitative map of this data, join the 311 data to another spatial dataset (census block groups) to aggregate it and display it based on its geographical location.

Mapping Data: World Populations

Mapping Data: World Populations

With this exercise, you will learn introductory skills involved in using QGIS to map existing spatial datasets. Using an example of world populations you will have become familiar with the QGIS user interface, learned the components of shapefiles, created a clear and effective map composition, critically considered symbology and classification and the differences, between mapping qualitative and quantitative information, created and calculated new fields in an attribute table, performed a table join to, combine additional data to an existing shapefile’s attribute table, queried a GIS dataset, using both tabular queries and spatial queries.