Interface design map

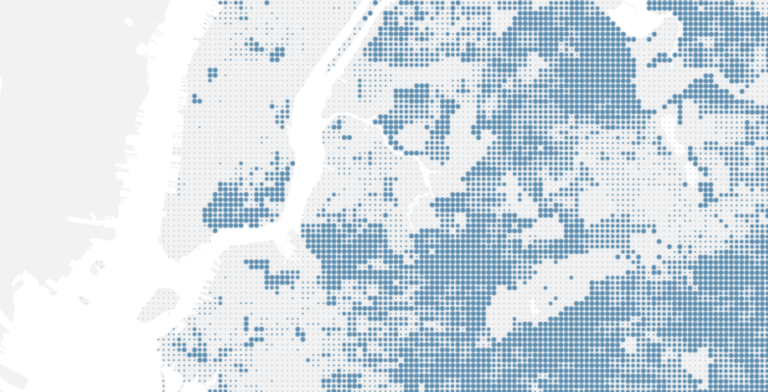
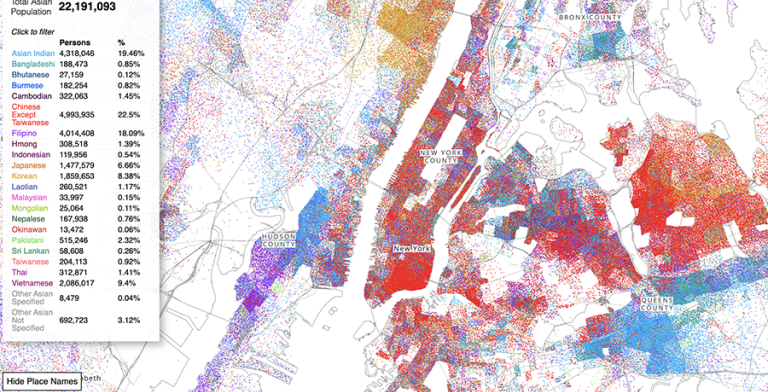
The Asian American Dot Density map represents each Asian American as 1 dot color coded by 21 different racial groups found in Census data. The map reveals the complex spatial dynamics of specific asian racial groups in places across the country.

Asian American Dot Density Map
144 of 10,049 homes purchased by investors in 2018 in Philadelphia.

This project investigates forms of investment in residential property that began to emerge in the lead up to the 2008 financial crisis, which have since morphed and firmly taken hold. Focused on Philadelphia, PA, the analysis traces the new geographies of real estate purchases made specifically by investors who do not intend to live in the homes they are buying.

Tracing Speculation
New COVID-19 cases in the past 14 days by county, percentile ranked within states

Mapping the New Politics of Care is a visual journey through the inequities and vulnerabilities that define the American landscape, using different definitions to describe communities at risk, down to the county level. The project is also designed to show visitors how the areas that appear most at risk within each state shifts depending on how vulnerability is measured: from COVID-19 cases to unemployment rates, from COVID-19 deaths to formal metrics of health vulnerability such as Years of Potential Life Lost and the Centers for Disease Control and Prevention’s Social Vulnerability Index.

Mapping the New Politics of Care
A few blocks on the Lower East Side as documented in William Perris’ 1852 Maps of the City of New York. (Source: New York Public Library)

Mapping Historical New York: A Digital Atlas visualizes Manhattan’s and Brooklyn’s transformations during the late-nineteenth and early-twentieth centuries. Drawing on 1850, 1880, and 1910 census data, it shows how migration, residential, and occupational patterns shaped the city.

Mapping Historical New York
Beyond the Census: Languages of Queens map

Conflict Urbanism: Language Ecologies explores the role that language plays in shaping urban space. Language interacts with its environment at multiple scales and with diverse media. As an ecology, language either dominates, or is vulnerable to its host environments. In this way it often makes conflict visible in urban settings.

Conflict Urbanism: Urban Language Ecologies
Origin and destination cities of more than 5,000 displaced people

On the eve of an historic and controversial peace agreement in Colombia we have launched an investigation into the spatial characteristics of the decades long conflict between multiple state and non-state actors in the country. We have provisionally titled this research Conflict Urbanism: Colombia. We analyze and visualize the documented aspects of the conflict in Colombia in order to put forward policy recommendations for the transitional justice and peacebuilding process.

Conflict Urbanism: Colombia
Green CabDestinations

Since 2008 yellow taxis have been able to process fare payments with credit cards, and credits cards are a growing share of total fare payments. However, the use of credit cards to pay for taxi fares varies widely across neighborhoods, and there are strong correlations between cash payments for taxi fares, cash payments for transit fares and the presence of unbanked or underbanked populations. In this paper we use multiple datasets to explore taxicab fare payments by neighborhood and examine how access to taxicab services is associated with use of conventional banking services.

The Banking Divide For Taxi Access: Evidence From New York City
CSR Aleppo Map

Conflict Urbanism: Aleppo is a call for inquiry and a call to action. It is an open-source, interactive, data-rich map of the city of Aleppo, at the neighborhood scale. Users can navigate the city, with the aid of high resolution satellite imagery from before and during the current civil war. It is also an invitation to students and other collaborators to record and narrate urban damage in Aleppo — at the cultural, infrastructural, or neighborhood scale — and to present that research in case studies which will be added to the website over time. 

Conflict Urbanism: Aleppo
Percentage of the population with only high-school level education or less

This project is an analysis of New York City neighborhoods according to specific health, demographic and environmental metrics. We worked with the New York Restoration Project (NYRP), which is developing a master plan to renovate a network of open spaces in Mott Haven and Port Morris in the South Bronx. Over the next several years, NYRP will fund the renovations and build them. As a first step, we will capture baseline health data and quality of life indicators which we will track as the project progresses.

NYRP - The Haven Project
Close up of hourly balance matrix

As has been recently documented by the press, one of the major challenges that Citi Bike is facing is the rebalancing of their stations. As origins and destinations of Citi Bike trips are not necessarily symmetrical during the day, Citi Bike has been forced to constantly move bikes around the city, taking them from full stations and delivering them to empty ones. This problem is both financially expensive and frustrating for Citi Bike users: many people complain about either not finding bikes at their stations of origin or not finding empty spots when they arrive at their final destinations.

CitiBike Rebalancing Study