Where respondents aspire to live in the future

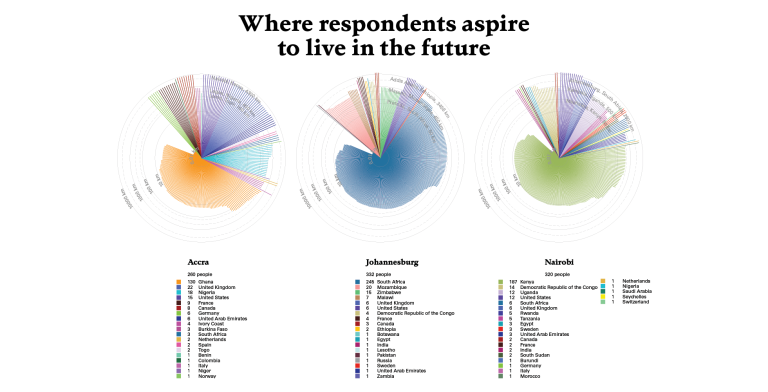
In an era of increased fluidity, political devolution, institutional fragmentation, and economic and environmental precarity, African cities are reshaping under a young population preparing for uncertain futures. This project seeks to understand the emerging patterns of human mobility, urbanism, and socio-political changes through extensive surveys in Accra, Nairobi, and Johannesburg, conducted by the African Centre for Migration and Society (ACMS). It visualizes residents' connections to place and captures the intricacies of their fragmented and uncertain lives. This research, in collaboration with the University of the Witwatersrand, aims to generate data for further academic exploration, policy reconsideration, and to enhance understanding of spatial inequality and future politics in Africa.

Atlas of Migration
Main page of census explorations

These experiments deal with how Census data is structured, packaged, and how it can be visualized interactively. Some address how these data points exist in the Census ecosystem, while others are technical opportunities and solutions. 

All code is always open to use, and open to accepting requests and changes.
 

Census Experiments
County Level Indices Comparison

This project compares data for 8 national indices, as well as the census measures that go into 15 additional indices to provide an overview of how indices are made, by whom, and for what purpose.

What is an index?
Census Atlas Homepage

This project visualizes the U.S. Census through the lens of 1 person’s location data over the course of 3 years. It addresses the potential of self quantification in the personalization of public aggregate data. We are constantly viewed through data collected from us. However, despite the increasing nuance and sophistication of classification and categorization systems, the formalization of categories is always going to be playing catch up to how we can define ourselves. Is it possible that we can challenge the transactional nature of our current relationship with data by viewing aggregate data through the lens of self knowledge?

Personal Census Atlas
Canners Homepage

We Can is a multimedia storytelling project that explores the lives and activity of canners, people who pick up cans and bottles on NYC streets. We combined oral history, manual data collection, mapping and illustration to encourage a more critical observation of a community and its subculture. The mapping component consists in GPS tracked canners’ daily itineraries that unfold, while revealing the quantitative and qualitative data collected manually.

We Can
CSR Featured Science Surveyor Visualization

One of the biggest challenges facing science journalists is the ability to quickly contextualize journal articles they are reporting on deadline. Science Surveyor is a tool that can help science journalists and others rapidly and effectively characterize the scientific literature for any topic by providing a contextual consensus, and a timeline of publications surrounding the topic.

Science Surveyor
Percentage of the population with only high-school level education or less

This project is an analysis of New York City neighborhoods according to specific health, demographic and environmental metrics. We worked with the New York Restoration Project (NYRP), which is developing a master plan to renovate a network of open spaces in Mott Haven and Port Morris in the South Bronx. Over the next several years, NYRP will fund the renovations and build them. As a first step, we will capture baseline health data and quality of life indicators which we will track as the project progresses.

NYRP - The Haven Project
Serendity Search

Today, when one walks into a library, whether public or private, there is no way to comprehend the immensity, character and value of its collection. Perhaps this is visible in the vastness of the stacks, or of the building, but for the most part, the collection remains invisible. “Serendipity Search” will allow for surfacing of books and other media stored in the library, into the hands of researchers and interested individuals through a more compelling and curiosity-provoking interface. In our current prototype, at the first level, we have visualized the Columbia Libraries collection in a single interactive interface. At the second level, we have designed our first tool which browses library book which have multiple subjects in their metadata.

The Library Project
Close up of hourly balance matrix

As has been recently documented by the press, one of the major challenges that Citi Bike is facing is the rebalancing of their stations. As origins and destinations of Citi Bike trips are not necessarily symmetrical during the day, Citi Bike has been forced to constantly move bikes around the city, taking them from full stations and delivering them to empty ones. This problem is both financially expensive and frustrating for Citi Bike users: many people complain about either not finding bikes at their stations of origin or not finding empty spots when they arrive at their final destinations.

CitiBike Rebalancing Study

Exits, a panoramic multi-media installation which was on view at the Cartier Foundation in Paris, France from November 2008 – March 2009 as part of “Elsewhere starts here,” conceptualized by Paul Virilio. The project was part of a larger exhibition, Terre Natale: Stop Eject.
 

Terre Natale: Exits Part 2